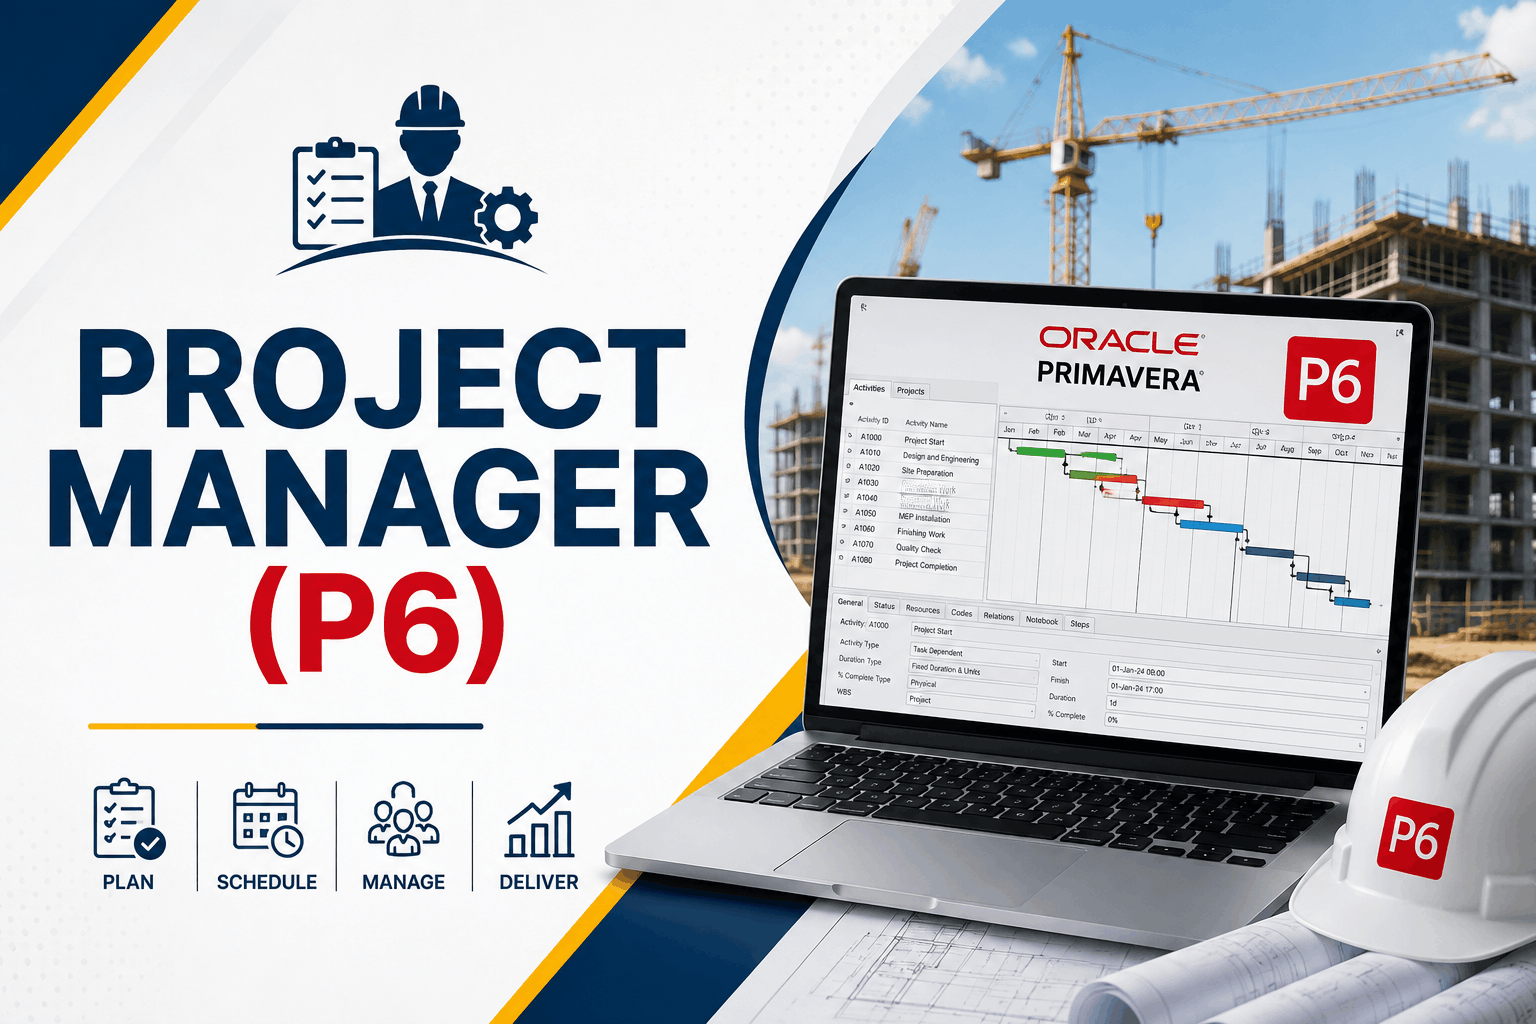
Project Manager (P6)
MODULE 1: - Advance Excel With (Ai)
I. Create Worksheets and Workbooks
- Create a workbook
- Import data from a delimited text file
- Add a worksheet to an existing workbook
- Copy and move a worksheet
II. Navigate in Worksheets and Workbooks
- Search for data within a workbook
- Navigate to a named cell, range, or workbook element
- Insert and remove hyperlinks
III. Format Worksheets and Workbooks
- Change worksheet tab color
- Rename a worksheet
- Change worksheet order
- Insert and delete columns or rows
- Change workbook themes
- Adjust row height and column width
- Insert headers and footers
IV. Customize Options and Views for Worksheets and Workbooks
- Hide or unhide worksheets
- Hide or unhide columns and rows
- Customize the Quick Access toolbar
- Modify document properties
- Display formulas
V. Configure Worksheets and Workbooks for Distribution
- Inspect a workbook for hidden properties or personal information
- Inspect a workbook for accessibility issues
- Inspect a workbook for compatibility issues
VI. Apply Custom Data Formats and Validation
- Create custom number formats
- Populate cells by using advanced Fill Series options
- Configure data validation
VII. Apply advanced conditional formatting and filtering Create custom conditional formatting rules
- Create conditional formatting rules that use formulas
- Manage conditional formatting rules
VII. Create and Modify Custom Workbook Elements
- Create and modify simple macros
- Insert and configure form controls
VIII. Create and Manage Tables
- Create an Excel table from a cell range
- Convert a table to a cell range
- Add or remove table rows and columns
IX. Manage Table Styles and Options
- Apply styles to tables
- Configure table style options
- Insert total rows
X. Filter and Sort a Table
- Filter records
- Sort data by multiple columns
- Change sort order
- Remove duplicate records
XI. Summarize Data by using Functions
- Insert references
- Perform calculations by using the SUM function
- Perform calculations by using MIN and MAX functions
- Perform calculations by using the COUNT function
- Perform calculations by using the AVERAGE function
- Perform Conditional Operations by using Functions
- Perform logical operations by using the IF function
- Perform logical operations by using the SUMIF function
- Perform logical operations by using the AVERAGEIF function
- Perform statistical operations by using the COUNTIF function
XII. Format and Modify Text by using Functions
- Format text by using RIGHT, LEFT, and MID functions
- Format text by using UPPER, LOWER, and PROPER functions
- Format text by using the CONCATENATE function
Format text by using the Exact function
- Format text by using the Len function
- Format text by using the Trim function
- Format text by using the Substitute function
- Format text by using the Search function
- Format text by using the Find function
XIII. Mathematical & Statical Function’s
- Perform by using Sum function
- Perform by using Product function
- Perform by using Average function
- Perform by using Ceiling function
- Perform by using Floor function
- Perform by using round function
- Perform by using Round Up function
- Perform by using Round Down function
- Perform by using Power function
- Perform by using Count function
- Perform by using Counta function
- Perform by using Maximum function
- Perform by using Minimum function
- Perform by using Mode function
- Perform by using Median function
- Perform by using Log function
- Perform by using Dollar function
- Perform by using Average function
- Perform by using Mina function
- Perform by using Maxa function
- Perform by using large function
- Perform by using Sqrt function
- Perform by using Mod function
- Perform by using Roman function
- Perform by using Rank function
- Perform by using Rank Average function
- Perform by using Rand function
- Perform by using Rand Between function
XIV. Date & Time Function’s
- Perform by using Days360 function
- Perform by using Date function
- Perform by using Network days function
- Perform by using Now function
- Perform by using Today function
- Perform by using Weekday function
- Perform by using Effect function
- Perform by using Eomonth function
- Perform by using Edate function
- Perform by using Workdays function
- Perform by using Dated if function
XIV. Lookup & Reference Function’s
- Index function
- Match function
- Lookup function
- Choose function
- Offset function
- Offset with Match function
- Lookup function
- Transpose function
- Hlookup For Single Worksheet
- Vlookup For Single Worksheet
- Hlookup & Vlookup for Multiple Sheet
- Match And Find Record by Vlookup and Hlookup
- Approximate Match with Vlookup
- Exact Match with Vlookup
- Nesting Lookup Function
- Show Formula
- Choose Function with Vlookup
- Index with Match function
- Vlookup with Trim function
- Indirect function
XV. Financial Function’s
- Pmt Function
- Rate Function
- Ppmt Function
- Ipmt Function
- Fv Function
- Pv Function
- Coupdays Function
- Coupnum Function
- Ispmt Function
- Sln Function
- Cumprinc Function
- Cumipmt Function
- Ddb Function
- Db Function
- Received Function
XVI. Database Function’s
- Daverage Function
- Dproduct Function
- Dmin Function
- Dmax Function
- Dcount Function
- Dcounta Function
- Dsum Function
- Dget Function
XVII. What –If Data Analysis
- Using Goal Seek
- Using Data Table
- Creating & Displaying Scenarios
XVIII. Customizing Macro By Action Button
- Creating a Macro with Condition
- Running a Macro, Editing a Macro
- Adding a menu to the Menu Bar
- Adding a Commands to a Menu
- Adding Buttons to a Toolbar
XIX. Working with Pivot Table & Pivot Chart
- Creating a Pivot Table
- Rearranging a Pivot Table
- Filtering Pivot Table Data
- Creating a Pivot Chart
XX. Reporting With Payroll Statement
- MIS Report
- Profit & Loss a/c statement
- Balance sheet
- Worker contribution statement
- Cash flow statement
- Debtor’s & Creditors statement
- Inventory statement
- BRS Statement
- Fixed Assets & fund statement
- Payroll Report
- P.F & E.S.I Report
XXI. Create Different Charts
- Create a new chart
- Add additional data series
- Switch between rows and columns in source data
- Analyze data by using Quick Analysis
- Format Charts
- Resize charts
- Add and modify chart elements
- Apply chart layouts and styles
- Move charts to a chart sheet
XXII. Protecting Excel Workbook & Sheet
- Locking/Unlocking Cells in a worksheet
- Protecting a Worksheet
- Protecting a Workbook
- Creating a Shared Workbook
- Tracking Changes to a Workbook
- Accepting & Rejecting Changes to a Workbook
- Password Protecting a Workbook
- Merging Workbooks
POWER BI
Introduction to Power BI
- What is Business Intelligence? What is Power BI? Components & Workflow
- Power BI vs Excel vs Tableau Installing Power BI Desktop Power BI Interface Walkthrough
- Connecting to Different Data Sources
- Excel, CSV, Text, Web, SQL, SharePoint
- Data Import vs Direct Query
- Understanding Query Editor (Power Query)
- Basic Data Transformations
- Rename, Remove, Replace, Split, Merge columns
- Filtering & Sorting data
- Handling nulls and errors
Data Transformation with Power Query
- M Language Basics
- Data Types & Type Conversion
- Pivot and Unpivot Columns
- Group By and Aggregate
- Merge and Append Queries (Joins)
- Creating Custom Columns
- Extracting date/time parts
Data Modelling
- Star vs Snowflake Schema
- Creating Relationships between tables
- Managing Relationships (Cardinality, Direction)
- Calculated Columns vs Measures
- Data categories and formatting
DAX (Data Analysis Expressions)
- Introduction to DAX
- Basic DAX Functions SUM, AVERAGE, COUNT, DISTINCTCOUNT
- Logical Functions: IF, SWITCH, AND, OR
- Time Intelligence: YTD, MTD, QTD, SAMEPERIODLASTYEAR
- Filter Functions: CALCULATE, FILTER, ALL
- Variables in DAX
Data Visualization in Power BI
- Visual Types: Bar, Line, Pie, Donut, Card, Table, Matrix, Map
- Slicers, Filters & Drill-through
- Conditional Formatting
- Tooltips & Interactions
- Bookmarks & Buttons
- Creating Dynamic Dashboards
Advanced Visualizations and Custom Visuals
- KPI Visuals and Gauges
- Waterfall and Funnel Charts
- Decomposition Tree & Q&A Visual
- Using Custom Visuals from AppSource
- R and Python Visuals in Power BI
PRIMAVERA
Module 1: Introduction on to Primavera P6
- Overview of Primavera P6 (Professional and EPPM versions)
- Role in project management (compared to MS Project)
- Understanding the P6 interface
- Application menus and layout
- Creating a new project
Module 2: Project and Enterprise Structure (EPS & OBS)
- Understanding Enterprise Project Structure (EPS)
- Organizational Breakdown Structure (OBS)
- Project codes and project security roles
Module 3: Creating a Project & Work Breakdown Structure (WBS)
- Setting up a new project
- Project calendars (global, project, resource)
- Creating WBS and understanding its importance
- Adding and organizing WBS elements
Module 4: Activities and Scheduling Basics
- Creating activities under WBS
- Activity types (Task Dependent, Resource Dependent, etc.)
- Activity durations
- Relationships (FS, SS, FF, SF)
Module 5: Resource and Cost Management
- Creating and managing resources (labour, non-labour, material)
- Resource calendars
- Assigning resources to activities
- Assigning costs
- Resource levelling
Module 6: Baselines and Progress Update
- Setting and managing baselines
- Updating project status: % complete, actuals
- Using Earned Value fields
- Rescheduling and adjusting plans
Module 7: Layouts, Filters, and Grouping
- Customizing layouts (Activity, Gantt Chart, Resource Usage)
- Filters and grouping
- Sorting and organizing data for better views
Module 8: Reporting and Printing
- Using pre-built and custom reports
- Creating tabular and graphical reports
- Exporting to Excel and PDF
- Printing layouts and reports
Project Manager (P6) Training center in West Delhi, Uttam nagar. Best certified computer course curriculum for professional learning institute near Dwarka, Uttam Nagar, Jankapuri, Tilak Nagar, Subhash Nagar, Tagore Garden, Rajouri Garden, Ramesh Nagar, Moti Nagar, Kirti Nagar, Shadipur, Patel Nagar, Rajendra Place, Karol Bagh, Jhandewalan, Ramakrishna Ashram, Connaught Place, vikaspuri, najafgarh, Delhi Cantt, Dhaula Kuan, Palam Colony, Palam Villag, Dabri, Hari Nagar, Fateh Nagar, Raja Garden, Punjabi Bagh, Shivaji Park, Paschim Vihar, Peeragarhi, Inderlok, Netaji Subhash Place, Pitampura, Rohini, Chandni Chowk, New Delhi, East Delhi, North Delhi, West Delhi.